RacePulse
RacePulse
RacePulse
A data-driven broadcast interface for live racing
A data-driven broadcast interface for live racing
A data-driven broadcast interface for live racing
THE CHALLENGE
THE CHALLENGE
THE CHALLENGE
Live broadcasts need to communicate constantly changing information without overwhelming the viewer.
The challenge was to design a broadcast interface that could respond to race events in real time while remaining clear, fast to understand, and visually engaging.
Live broadcasts need to communicate constantly changing information without overwhelming the viewer.
The challenge was to design a broadcast interface that could respond to race events in real time while remaining clear, fast to understand, and visually engaging.
Live broadcasts need to communicate constantly changing information without overwhelming the viewer.
The challenge was to design a broadcast interface that could respond to race events in real time while remaining clear, fast to understand, and visually engaging.
THE CONCEPT
THE CONCEPT
THE CONCEPT
Designing for the moment, not just the screen
Instead of designing a collection of static broadcast panels, I approached RacePulse as a connected interactive system.
A single race event could trigger multiple responses across the interface.
Designing for the moment, not just the screen
Instead of designing a collection of static broadcast panels, I approached RacePulse as a connected interactive system.
A single race event could trigger multiple responses across the interface.
Designing for the moment, not just the screen
Instead of designing a collection of static broadcast panels, I approached RacePulse as a connected interactive system.
A single race event could trigger multiple responses across the interface.
OVERTAKE
↓
Leaderboard updates
↓
Driver Focus changes
↓
Driver highlights on circuit
↓
Event Feed reports the event
OVERTAKE
↓
Leaderboard updates
↓
Driver Focus changes
↓
Driver highlights on circuit
↓
Event Feed reports the event
OVERTAKE
↓
Leaderboard updates
↓
Driver Focus changes
↓
Driver highlights on circuit
↓
Event Feed reports the event
INFORMATION ARCHITECTURE
INFORMATION ARCHITECTURE
INFORMATION ARCHITECTURE
Live broadcasts need to communicate constantly changing information without overwhelming the viewer.
The challenge was to design a broadcast interface that could respond to race events in real time while remaining clear, fast to understand, and visually engaging.
Live broadcasts need to communicate constantly changing information without overwhelming the viewer.
The challenge was to design a broadcast interface that could respond to race events in real time while remaining clear, fast to understand, and visually engaging.
Live broadcasts need to communicate constantly changing information without overwhelming the viewer.
The challenge was to design a broadcast interface that could respond to race events in real time while remaining clear, fast to understand, and visually engaging.
Live broadcasts need to communicate constantly changing information without overwhelming the viewer.
The challenge was to design a broadcast interface that could respond to race events in real time while remaining clear, fast to understand, and visually engaging.
Live broadcasts need to communicate constantly changing information without overwhelming the viewer.
The challenge was to design a broadcast interface that could respond to race events in real time while remaining clear, fast to understand, and visually engaging.
Live broadcasts need to communicate constantly changing information without overwhelming the viewer.
The challenge was to design a broadcast interface that could respond to race events in real time while remaining clear, fast to understand, and visually engaging.
THE INTERFACE
THE INTERFACE
THE INTERFACE
Live Leaderboard
Live Leaderboard
Live Leaderboard
The leaderboard provides the fastest way to understand the current race order.
The key interaction is the dynamic position swap.
When a driver overtakes another:
The leaderboard provides the fastest way to understand the current race order.
The key interaction is the dynamic position swap.
When a driver overtakes another:
The leaderboard provides the fastest way to understand the current race order.
The key interaction is the dynamic position swap.
When a driver overtakes another:
P1 VER +0.000
P2 NOR +0.842
P1 VER +0.000
P2 NOR +0.842
P1 VER +0.000
P2 NOR +0.842
becomes
becomes
P1 NOR +0.000
P2 VER +0.214
P1 NOR +0.000
P2 VER +0.214
P1 NOR +0.000
P2 VER +0.214
Rather than instantly replacing the values, the rows transition between positions to make the change easy to follow.
Rather than instantly replacing the values, the rows transition between positions to make the change easy to follow.
Rather than instantly replacing the values, the rows transition between positions to make the change easy to follow.


Driver Focus
Driver Focus
Driver Focus
A closer look at the driver
The Driver Focus card provides detailed information about the currently selected driver.
It includes:
Position
Gap
Last lap
Best lap
Tire compound
Tire age
DRS
ERS
A closer look at the driver
The Driver Focus card provides detailed information about the currently selected driver.
It includes:
Position
Gap
Last lap
Best lap
Tire compound
Tire age
DRS
ERS
A closer look at the driver
The Driver Focus card provides detailed information about the currently selected driver.
It includes:
Position
Gap
Last lap
Best lap
Tire compound
Tire age
DRS
ERS
The component was designed as a reusable system rather than being tied to a single driver.
Changing the selected driver updates the content and visual state of the card.
The component was designed as a reusable system rather than being tied to a single driver.
Changing the selected driver updates the content and visual state of the card.
The component was designed as a reusable system rather than being tied to a single driver.
Changing the selected driver updates the content and visual state of the card.


Circuit Map
Circuit Map
Circuit Map
Visualizing the race beyond the leaderboard
The circuit map provides spatial context by showing driver positions directly on the track.
Drivers move along the circuit while the selected driver receives additional visual emphasis.
This creates a direct relationship between:
Visualizing the race beyond the leaderboard
The circuit map provides spatial context by showing driver positions directly on the track.
Drivers move along the circuit while the selected driver receives additional visual emphasis.
This creates a direct relationship between:
Visualizing the race beyond the leaderboard
The circuit map provides spatial context by showing driver positions directly on the track.
Drivers move along the circuit while the selected driver receives additional visual emphasis.
This creates a direct relationship between:
Driver Focus ↔ Circuit Map
Driver Focus ↔ Circuit Map
Driver Focus ↔ Circuit Map
Selecting a driver doesn't just change the information card. Their position on the circuit becomes part of the same interaction.
Selecting a driver doesn't just change the information card. Their position on the circuit becomes part of the same interaction.
Selecting a driver doesn't just change the information card. Their position on the circuit becomes part of the same interaction.


Live Event Feed
Live Event Feed
Live Event Feed
Making race events visible
The Event Feed communicates important moments as they happen:
Making race events visible
The Event Feed communicates important moments as they happen:
Making race events visible
The Event Feed communicates important moments as they happen:
Overtakes
Fastest laps
Pit stops
Safety events
Race completion
Overtakes
Fastest laps
Pit stops
Safety events
Race completion
Overtakes
Fastest laps
Pit stops
Safety events
Race completion
Events enter and leave the feed through animated transitions, allowing the interface to communicate change without disrupting the rest of the broadcast.
Events enter and leave the feed through animated transitions, allowing the interface to communicate change without disrupting the rest of the broadcast.
Events enter and leave the feed through animated transitions, allowing the interface to communicate change without disrupting the rest of the broadcast.


DESIGNING THE MOTION SYSTEM
DESIGNING THE MOTION SYSTEM
DESIGNING THE MOTION SYSTEM
Motion communicates change.
I used motion primarily to communicate state changes rather than as decoration.
Motion communicates change.
I used motion primarily to communicate state changes rather than as decoration.
Motion communicates change.
I used motion primarily to communicate state changes rather than as decoration.
Position changes
I used motion primarily to communicate state changes rather than as decoration.
Position changes
I used motion primarily to communicate state changes rather than as decoration.
Position changes
I used motion primarily to communicate state changes rather than as decoration.
Data changes
Timing values update through animated transitions rather than abrupt replacements.
Data changes
Timing values update through animated transitions rather than abrupt replacements.
Data changes
Timing values update through animated transitions rather than abrupt replacements.
Selection
Selected drivers receive subtle scale and emphasis changes.
Selection
Selected drivers receive subtle scale and emphasis changes.
Selection
Selected drivers receive subtle scale and emphasis changes.
Events
New race events enter the interface with controlled movement and exit naturally from the feed.
Events
New race events enter the interface with controlled movement and exit naturally from the feed.
Events
New race events enter the interface with controlled movement and exit naturally from the feed.
The goal was to make changing information easier to understand, not simply more animated.
The goal was to make changing information easier to understand, not simply more animated.
The goal was to make changing information easier to understand, not simply more animated.

RIVE IMPLEMENTATION
RIVE IMPLEMENTATION
RIVE IMPLEMENTATION
From static interface to interactive system
RacePulse was built as an interactive Rive experience rather than a collection of pre-rendered animations.
From static interface to interactive system
RacePulse was built as an interactive Rive experience rather than a collection of pre-rendered animations.
From static interface to interactive system
RacePulse was built as an interactive Rive experience rather than a collection of pre-rendered animations.
State Machines
Used to control different interaction states and transitions.
State Machines
Used to control different interaction states and transitions.
State Machines
Used to control different interaction states and transitions.

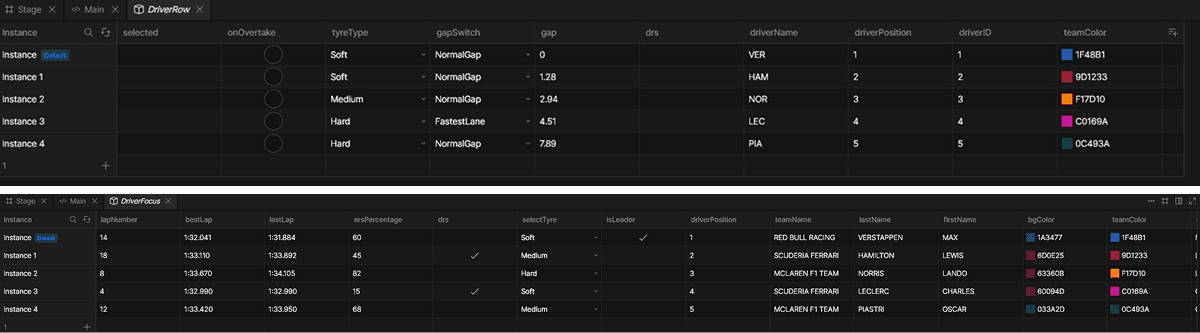
Data Binding
Used to connect dynamic race data to UI elements and keep components reusable.
Data Binding
Used to connect dynamic race data to UI elements and keep components reusable.
Data Binding
Used to connect dynamic race data to UI elements and keep components reusable.
Rive Scripting
Used to handle the interaction logic that coordinates changes across the broadcast interface, allowing a single race event to trigger multiple UI responses.
Rive Scripting
Used to handle the interaction logic that coordinates changes across the broadcast interface, allowing a single race event to trigger multiple UI responses.
Rive Scripting
Used to handle the interaction logic that coordinates changes across the broadcast interface, allowing a single race event to trigger multiple UI responses.
Interactive Components
Built reusable components such as driver rows, event cards, and driver states that can respond to changing data.
Interactive Components
Built reusable components such as driver rows, event cards, and driver states that can respond to changing data.
Interactive Components
Built reusable components such as driver rows, event cards, and driver states that can respond to changing data.


FINAL EXPERIENCE
FINAL EXPERIENCE
FINAL EXPERIENCE
A live broadcast interface designed around changing data and connected motion.
A live broadcast interface designed around changing data and connected motion.
A live broadcast interface designed around changing data and connected motion.

Reflections
Reflections
Reflections
Key Learnings
Key Learnings
Key Learnings
This project changed how I approach motion in product interfaces. Instead of treating animation as something added after the UI is designed, I started thinking about motion as part of the information architecture itself.
This project changed how I approach motion in product interfaces. Instead of treating animation as something added after the UI is designed, I started thinking about motion as part of the information architecture itself.
This project changed how I approach motion in product interfaces. Instead of treating animation as something added after the UI is designed, I started thinking about motion as part of the information architecture itself.
Designing RacePulse also pushed me to think beyond individual components and consider how a single event can propagate through an entire interface.
Designing RacePulse also pushed me to think beyond individual components and consider how a single event can propagate through an entire interface.
Designing RacePulse also pushed me to think beyond individual components and consider how a single event can propagate through an entire interface.